Page Speed & Core Web Vitals
Core Web Vitals measure real-world loading, interactivity, and visual stability. Learn the three metrics, their thresholds, and how they fit into the technical audit.
What you'll learn
- Understand the three Core Web Vitals metrics and what each one measures
- Know Google's Good / Needs Improvement / Poor thresholds for each
- Understand the difference between field data (CrUX) and lab data (Lighthouse)
- Learn the most common fixes for each metric
The Three Core Web Vitals
| Metric | Measures | Good | Poor |
|---|---|---|---|
| LCP (Largest Contentful Paint) | How long the largest visible element takes to render | ≤ 2.5s | > 4.0s |
| INP (Interaction to Next Paint) | Responsiveness — delay between a user action and the next visual update | ≤ 200ms | > 500ms |
| CLS (Cumulative Layout Shift) | Visual stability — how much content unexpectedly shifts as the page loads | ≤ 0.1 | > 0.25 |
Field Data vs. Lab Data
Google uses two different sources when evaluating Core Web Vitals, and they answer different questions:
- CrUX (field data) — real anonymized measurements from actual Chrome users visiting the page. This is what Google uses for ranking-related signals. Low-traffic pages may not have enough CrUX data to report.
- Lighthouse (lab data) — a simulated test run in a controlled environment. Useful for debugging and reproducing issues, but does not reflect real-user network conditions or device variety.
Common Fixes by Metric
- LCP: compress and properly size the largest image/hero element, preload it, remove render-blocking CSS/JS, use a CDN
- INP: break up long JavaScript tasks, reduce main-thread work, defer non-critical scripts
- CLS: always set explicit width/height on images and embeds, reserve space for ads and dynamically injected content, avoid inserting content above existing content after load
Test your homepage and 2-3 key pages, then run the same test on 2-4 competitor URLs. A Core Web Vitals ticket lands much better with clients when it shows exactly how far behind (or ahead) the site is compared to the competition it's measured against.
The Full Competitor-Benchmarking Method
A budget is really just the worst performance you're willing to accept for the site. Rather than guessing at a target, set it from a competitor comparison:
- Pull 3-4 promoted pages of different types from the client's site — homepage, an internal landing/listing page, an article or product card. Always include real promoted internal pages, not just the homepage.
- Pull the equivalent page type from at least 5 top-ranking competitors with strong visibility — you should end up with 18+ URLs total (client pages included).
- Connect a PageSpeed Insights API key to Screaming Frog (version 12+) under API settings, confirm it shows "Connected," and select only the metrics you actually need — CrUX for mobile, desktop fully disabled.
- Crawl all the URLs in List mode and open the PageSpeed report; export the results into a comparison spreadsheet.
To judge the result: if the client's site has CrUX data, prioritize the CrUX columns (First Contentful Paint Time, First Input Delay Time, and their Origin-level equivalents) against the percentile you're targeting. If it doesn't have CrUX data, fall back to Performance Score, Time to First Byte, First Contentful Paint, Speed Index, and Time to Interactive (this last one can be noisy). If every metric is within the target percentile, there's no critical problem — report that the site's speed is on par with top competitors. If even one metric misses, a manual deep-dive is needed.

Manual Deep-Dive: WebPageTest
Pick the competitor whose CrUX Origin First Contentful Paint (or Performance Score, if no CrUX) sits closest to your target percentile. Take two pages from the client's site — the homepage and the slowest internal page from the previous step — and the equivalent two pages from that competitor. Run all four through PageSpeed Insights and compare mobile results directly; a clear, consistent gap confirms a real speed problem and gives you the service's own optimization recommendations to build the ticket from.
For a harder problem — say Total Blocking Time is high and you need to know exactly what's occupying the main thread — WebPageTest's waterfall view shows every request in sequence and what's blocking what.
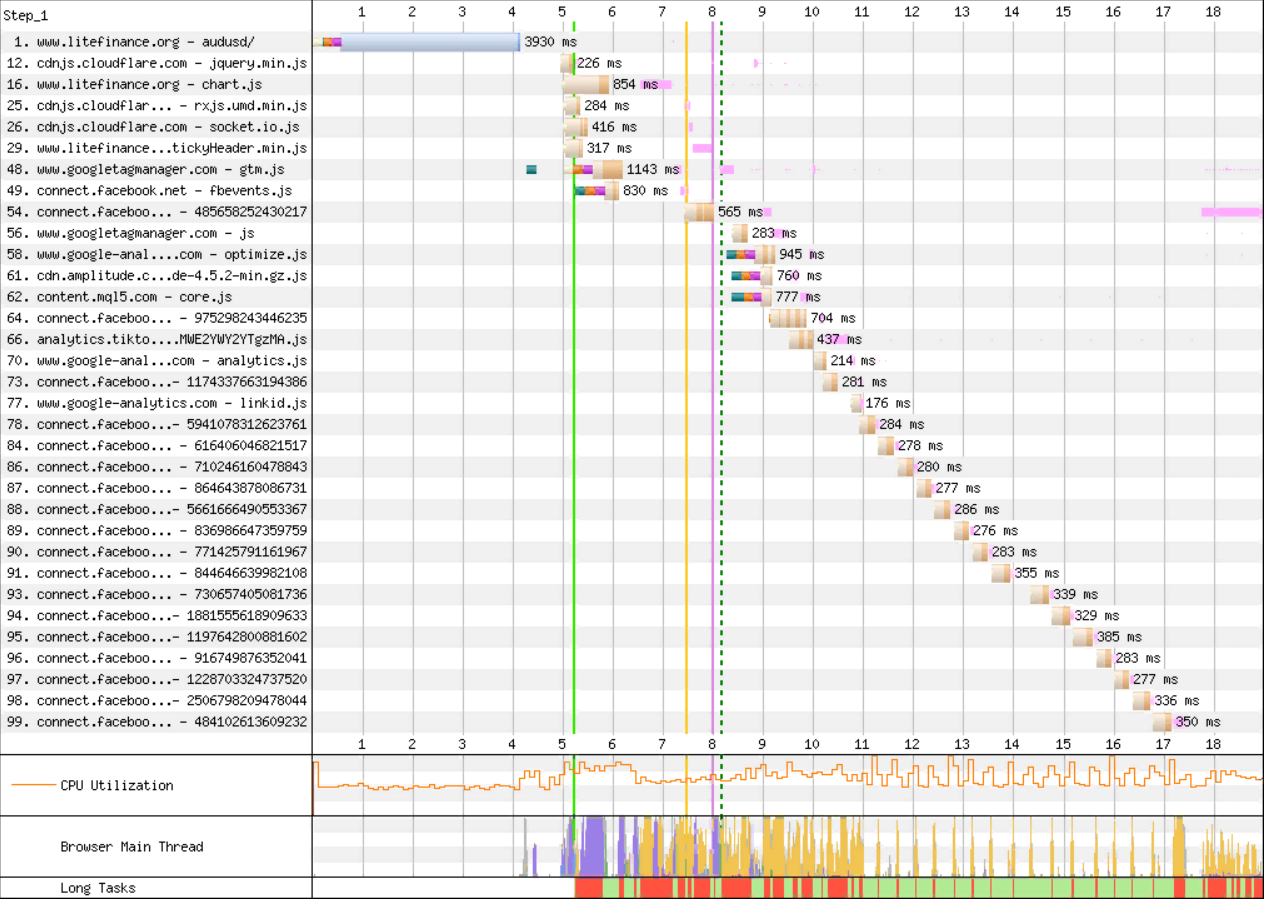
RequestMap is a useful companion tool — it visualizes which scripts trigger which follow-up requests (a single third-party tag can easily fan out into dozens of downstream calls), which helps decide what's safe to defer.
Presenting Results Visually
Numbers alone rarely land with a client — WebPageTest's video-comparison tool runs the client's site side-by-side against a competitor and produces a filmstrip and a GIF of the loading race, which communicates a speed gap far more convincingly than a metrics table.
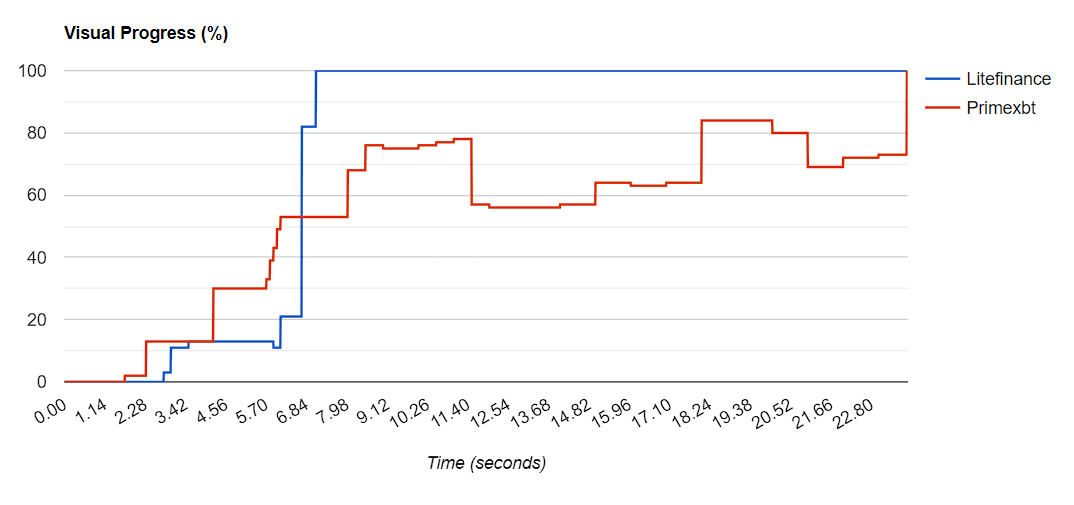
Writing the Ticket: What's Wrong → How It Should Be → How to Improve
The client's own developers own the implementation, but the ticket needs to give them a clear, evidenced starting point in that three-part format, built from PageSpeed Insights' own findings. Work top-down: start with the "Optimization" section's red (≥1 second impact) items first, then yellow items only if they add up to something meaningful (skip anything under ~0.3s unless there are many of them). The "Diagnostics" section is for advanced readers — usually fine to hand straight to developers as-is. Always get sign-off from your group lead before sending a performance ticket to the client.
Common, high-confidence recommendations worth having ready:
- Low TTFB, no CDN — recommend a CDN; Cloudflare's free tier is a reasonable first test.
- WordPress sites — caching/optimization plugins (WP Rocket, LiteSpeed Cache, Smush) often resolve a large share of issues with minimal developer effort.
- "Serve images in next-gen formats" — recommend modern formats (WebP etc.), but check the client's actual audience isn't disproportionately on a browser with poor support (Edge, historically), or have the server negotiate format by browser.
- "Defer offscreen images" losing 2+ seconds — recommend native lazy loading:
<img src="image.png" loading="lazy" alt="…" width="200" height="200">. - Render-blocking resources — pass the detailed list straight to the developers; there's usually nothing more to add from the SEO side.
- A single diagnostics item blocking the thread for 1+ second — usually a third-party tag (live-chat widgets, CAPTCHAs, comment widgets like Disqus); recommend deferred loading specifically for that category of script.
Monitoring and Developer Tooling
Setting a budget only matters if it's tracked. Tools worth recommending to a client's dev team: Lighthouse CI, which can run directly against GitHub pull requests and fail a build when a performance budget regresses, catching problems before they ship; a performance budget calculator to hand developers pre-built budget numbers; and, for larger or VIP accounts, SpeedCurve, a dashboard that tracks budgets over time and alerts the team on regression.
Which Devices to Target
Check Google Analytics under Audience → Mobile → Devices to see what the client's actual visitors use — deliberately exclude high-end devices like the latest iPhone from your baseline, since they mask real-world performance problems. BrowserStack SpeedLab lets you compare load times on those specific devices against competitors, and BrowserStack Live lets you watch the page load in real time on the actual device.
Key Takeaways
- Core Web Vitals has three metrics: LCP (loading), INP (interactivity), CLS (visual stability)
- Google's ranking-related signal uses field data (CrUX), not lab data (Lighthouse)
- Low-traffic pages may lack enough CrUX data — use Lighthouse for those as the fallback
- Each metric has a distinct, specific fix — there is no single "speed optimization" that fixes all three
- A full benchmark compares 18+ URLs (client + 5 competitors × page types) via Screaming Frog's PageSpeed integration before deciding whether a real problem exists
- Write tickets as What's wrong → How it should be → How to improve, working the "red" (≥1s impact) PageSpeed items first, and always get group-lead sign-off before sending to the client
- WebPageTest's video comparison (filmstrip/GIF) sells a speed problem to a client far better than a metrics table alone